Unit 11 · Lesson 11.2
Fairness in security decisions
Security decisions are made about people as well as about packets. A fraud model declines a card payment; an account-protection system locks an account; an insider-threat tool flags an employee for investigation; a moderation system removes a post; a face-recognition gate refuses entry. Each of these systems makes errors, and the errors can fall unevenly on different groups of people. This lesson defines the main statistical criteria of group fairness, states exactly which of them can and cannot hold together and under what assumptions, shows how per-group thresholds trade one criterion for another, and explains why privacy protections do not settle fairness questions and can widen gaps.
Where error rates differ
Large-scale evidence of unequal errors in a security technology comes from face recognition. NIST's evaluation of demographic effects, NISTIR 8280 (December 2019), found that false positive rates of contemporary algorithms often varied across demographic groups by factors of 10 to beyond 100, while false negative rates tended to vary by factors below 3 and were more specific to the algorithm (Grother et al., 2019). The report also notes that in cooperative access control a false negative can usually be remedied by a second attempt, while a false positive in verification admits an impostor and a false positive in surveillance by one-to-many identification may lead to a false accusation. Which error matters, and for whom, depends on the application.
Security data make such gaps likely for structural reasons. Groups can differ in base rate, as the two sites of the course dataset do, since site B, the branch office, has weaker patching and a higher share of attack records (Lesson 1.3). They can differ in normal behavior that resembles attacks, as site B's heavier remote administration does. And labels come from past investigations, which happen where someone already looked. None of this requires a protected attribute to be a model input. Lab 11 audits a detector whose inputs do not include the site, and its error rates still differ between the two sites, although under one global threshold the intervals around them overlap.
Notation and the main criteria
Let \(A \in \{a, b\}\) be the group, \(Y \in \{0, 1\}\) the true class (1 for an attack, a fraud or another positive), \(S\) the detector's score and \(\hat{Y} = \mathbb{1}[S \ge t]\) its decision at threshold \(t\). Write \(\pi_g = P(Y = 1 \mid A = g)\) for the base rate of group \(g\). The criteria below each require some probability to be equal across the groups.
Demographic parity requires equal alert rates,
Equal opportunity, defined by Hardt et al. (2016), requires equal true positive rates,
Equalized odds, also from Hardt et al. (2016), requires the decision to be independent of the group given the true class, which for a binary decision means two separate equalities, one for each class \(y \in \{0, 1\}\),
that is, equal true positive rates and equal false positive rates. It is not a condition on their sum. A detector with a true positive rate of 0.9 and a false positive rate of 0.1 for one group and 0.8 and 0.2 for the other has equal sums and unequal odds.
Predictive parity, in the terminology of Chouldechova (2017), requires equal precision (positive predictive value),
Calibration within groups, the first condition of Kleinberg et al. (2017), applies to scores. It requires, for every score value \(s\) and every group \(g\), that among the members of group \(g\) who receive score \(s\), a fraction \(s\) are positive,
Each criterion encodes a different view of what is owed to whom. In an account-protection system, equal false positive rates mean that legitimate users of both groups are locked out equally often, and equal true positive rates mean that both groups' accounts are equally well protected against takeover. Equal precision means that an analyst who sees an alert can trust it equally whichever group it concerns. Calibration means that a score of 0.3 carries the same meaning for everyone, which is what a downstream decision rule such as the cost threshold of Lesson 1.2 assumes.
Which criteria can hold together
Several criteria cannot hold simultaneously except in special cases. The results are precise, and the special cases matter as much as the impossibility.
Predictive parity and equalized odds. From the confusion matrix of one group, Chouldechova (2017) derives the identity
where \(\pi\) is the group's base rate, PPV its precision and FNR = 1 − TPR its false negative rate. If two groups have equal precision and equal false negative rates but different base rates, the right-hand side differs between them, so their false positive rates must differ. With a precision of 0.75 and a false negative rate of 0.2 in both groups, base rates of 3% and 6% force false positive rates of 0.82% and 1.70%. The identity is arithmetic, so it holds for any binary decision; the only escapes are equal base rates or extreme classifiers whose precision is 1 or whose true positive rate is 0.
Calibration and balance. Kleinberg et al. (2017) consider risk scores and three conditions: calibration within groups \eqref{eq:calib}; balance for the negative class, meaning equal average scores for the negatives of both groups; and balance for the positive class, meaning equal average scores for the positives. The last two are score-based counterparts of equal false positive and true positive rates. They prove that a way of assigning scores that satisfies all three exists only if perfect prediction is possible (every feature vector determines the class with certainty, so every score can be 0 or 1) or the groups have equal base rates, and that satisfying all three approximately requires the data to be close to one of those two special cases. The result holds however the scores are computed.
Calibration and one error rate. Pleiss et al. (2017) show that calibration is compatible with only a single error constraint, such as equal false negative rates (in their generalized, score-based sense), and that any algorithm achieving calibration together with that relaxation is no better than randomizing a share of the predictions of an existing classifier.
Demographic parity and equal opportunity can hold together. Nothing forbids equal alert rates and equal true positive rates at the same time, even with different base rates. The alert rate of group \(g\) is \(\mathrm{TPR}\,\pi_g + \mathrm{FPR}_g(1 - \pi_g)\). Take \(\pi_a = 0.02\), \(\pi_b = 0.06\), a common true positive rate of 0.8 and \(\mathrm{FPR}_a = 0.05\). Group \(a\)'s alert rate is \(0.016 + 0.049 = 0.065\), and group \(b\) has the same alert rate if \(0.048 + 0.94\,\mathrm{FPR}_b\) equals 0.065, that is \(\mathrm{FPR}_b = 0.0181\). Both criteria hold. What fails is equalized odds, because the group with more attacks must have fewer false alerts for its alert rate to stay at the common level.
The table below collects these statements.
| Pair of criteria | Both hold if base rates differ? | Source |
|---|---|---|
| Demographic parity and equal opportunity | Yes, with unequal false positive rates | Worked example |
| Predictive parity and equalized odds | No, unless precision is 1 or TPR is 0 | Chouldechova (2017), \eqref{eq:chouldechova} |
| Calibration within groups and both balance conditions | No, unless prediction is perfect | Kleinberg et al. (2017) |
| Calibration within groups and one error-rate condition | Yes, but no better than randomizing part of an existing classifier | Pleiss et al. (2017) |
| Equalized odds and demographic parity | No, unless TPR = FPR (a chance-level detector) | Alert-rate formula |
The last row follows from the alert-rate formula. If both error rates are equal across groups, the alert rates are \(\mathrm{TPR}\,\pi_g + \mathrm{FPR}(1 - \pi_g)\), which differ when the base rates differ unless \(\mathrm{TPR} = \mathrm{FPR}\), a detector no better than chance.
Show the answer
For group a, true alerts are \(0.8 \times 0.03 = 0.024\) and false alerts \(0.01 \times 0.97 = 0.0097\) of all customers, so the alert rate is 0.0337 and precision \(0.024/0.0337 = 0.712\). For group b, true alerts are 0.048 and false alerts 0.0094, so the alert rate is 0.0574 and precision 0.836. Equalized odds (and therefore equal opportunity) holds; predictive parity and demographic parity fail, as equation \eqref{eq:chouldechova} and the alert-rate formula predict for unequal base rates. Figure 11.3 plots the same effect over a range of base rates.
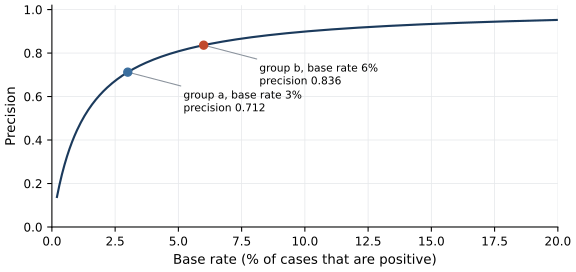
Figure 11.3. Precision as a function of the base rate for a detector whose true positive rate (0.8) and false positive rate (0.01) are the same in every group, computed from Bayes' rule as in Lesson 1.2. Markers show the two groups of the first Check your understanding question above, with base rates of 3% and 6%. Because precision rises with the base rate, equal error rates imply unequal precision whenever base rates differ, which is the content of equation \eqref{eq:chouldechova}.
The impossibility results do not say that fairness is meaningless or that any choice is as good as any other. They say that a system's designers must choose which property to equalize, given who bears which error, and must report the others.
Per-group thresholds
One intervention, post-processing, leaves the model untouched and chooses a separate threshold for each group. Hardt et al. (2016) showed how to find, among all predictors derived from the score \(S\) and the group attribute \(A\) alone, the one that satisfies equalized odds or equal opportunity with the smallest expected loss. Each group's achievable pairs of false and true positive rates form the convex hull of its ROC curve, which for a concave curve is the region under the curve and above the main diagonal. Equalized odds requires both groups to operate at the same point, so the feasible points lie in the intersection of the two hulls, and the best one lies on the upper-left boundary of that intersection. A point on that boundary may lie strictly below one group's ROC curve, in which case that group's decision must randomize between two thresholds. Equal opportunity constrains only the true positive rate and, when the ROC curves are continuous, needs no randomization, just a threshold per group.
Two cautions apply in security. Per-group thresholds require the group attribute at decision time, which may be unavailable, unreliable or restricted. And thresholds are fitted on past data, so what they equalize on that data need not stay equal later. Lab 11 shows both the mechanism and the second caution on the course dataset. Figure 11.4 shows the detector's ROC curve for each site and the operating points of three policies.
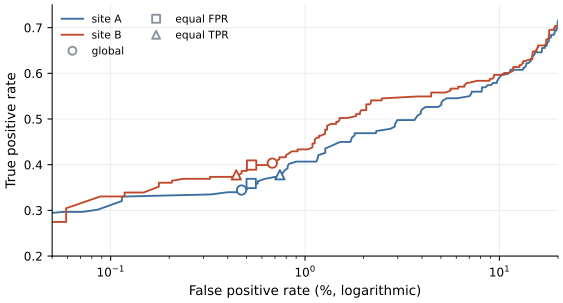
Figure 11.4. ROC curves of the Lab 11 detector (logistic regression trained on days 0 to 9) on the test days 10 to 13, separately for site A (main office) and site B (branch office). The false positive rate axis is logarithmic and both axes are cropped to the region around the operating points (false positive rates from 0.05% to 20%, true positive rates from 0.2 to 0.75). Circles mark each site's operating point under one global threshold; squares under per-site thresholds that equalize the false positive rate; triangles under per-site thresholds that equalize the true positive rate. The per-site thresholds in this figure were chosen on the test days themselves, as a retrospective audit.
Under the global threshold, the false positive rate at site A was 0.47% and at site B 0.68%, and the true positive rates were 0.34 and 0.40. The false positive rates rest on 33 and 23 false alerts, and for both rates the bootstrap intervals of the two sites overlap, so these differences are not established by four days of data. Equalizing the false positive rate on the test days moved the gap in the true positive rate (site B minus site A) from +0.059 to +0.040; equalizing the true positive rate moved the gap in the false positive rate from +0.0021 to -0.0030. Each policy equalized the rate it targeted and left a gap in the other, with overlapping intervals; equalizing the true positive rate reversed the gap in false positive rates, so that site A had the higher rate, and it raised the total number of false alerts from 56 to 67. Thresholds equalized in advance on the training days did not stay equal; on the test days they gave site B a false positive rate of 0.97% against 0.20% at site A. Figure 11.5 shows the rates with their intervals.
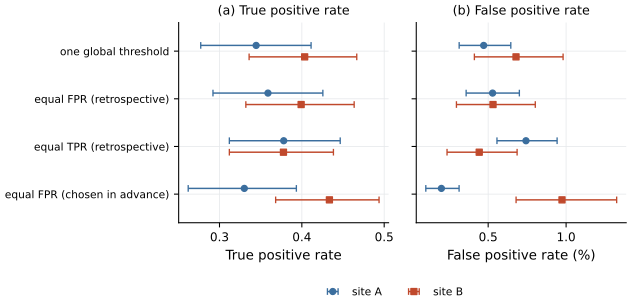
Figure 11.5. Error rates of the Lab 11 detector at the two sites on the test days, with bootstrap 95% intervals (1,000 resamples of connections within each site). (a) True positive rate. (b) False positive rate. Rows are four threshold policies: one global threshold; per-site thresholds that equalize the false positive rate or the true positive rate on the test days (retrospective); and per-site thresholds that equalize the false positive rate on the training days (chosen in advance).
Show the answer
No criterion holds by construction. A site feature lets the model shift scores by site, which can change both error rates in either direction; whether the gap narrows has to be measured on held-out data, per site, with intervals, exactly as in the lab. The auditor should also check calibration within each site, whether the site feature merely encodes the base rate (raising the alert rate at site B without improving its precision), and whether using the site in the decision is acceptable for this application. The change also creates a new dependency, since the model's behavior at a site now rests on how representative that site's training data were.
Privacy and fairness
Privacy protections interact with fairness, and the interaction is not benign. Bagdasaryan et al. (2019) trained models with differentially private stochastic gradient descent (DP-SGD, Lesson 8.3) and found that the accuracy cost of privacy fell disproportionately on underrepresented classes and subgroups. A gender classifier trained with DP-SGD was much less accurate on Black faces than on white faces, and the gap was larger than without differential privacy. They trace the effect to gradient clipping and noise, which affect rare and complex subgroups disproportionately. Differential privacy is therefore not a fairness intervention; if the original model is unfair, the private model can be more so, and a privacy-preserving pipeline needs its own per-group evaluation.
A second tension concerns measurement itself. Checking per-group error rates requires knowing who belongs to which group, which may mean processing sensitive personal data that privacy rules restrict. The original AI Act allowed providers of high-risk systems, in Article 10(5), to process special categories of personal data exceptionally and where strictly necessary to detect and correct bias. The 2026 amendment moves that permission into a new Article 4a and extends it, under the same conditions, to deployers of high-risk systems and to providers and deployers of other AI systems and models. The conditions include pseudonymization, strict controls and documentation of access, and deletion once the bias has been corrected (European Parliament and Council of the European Union, 2024; European Parliament and Council of the European Union, 2026). In security settings that are not covered by such provisions, the group variable available for an audit is often a proxy, such as a site, a business unit or a region, and the audit has to say so.
What the lab shows
Lab 11
Auditing a detector across two sites
Open in ColabRead with outputsNotebook on GitHubAbout 1 minute to run on a laptop CPU
Lab 11 trains the detector of Lab 1 on days 0 to 9, chooses its threshold from out-of-fold scores, and audits it on days 10 to 13 by site: base rates, true and false positive rates, precision, alert rates and calibration, with bootstrap intervals. It then computes the per-site thresholds of Figure 11.4, compares their costs, and generates a model card from the results.
Summary
Group fairness criteria ask for equal alert rates (demographic parity), equal true positive rates (equal opportunity), equal true and false positive rates (equalized odds, two equalities rather than one sum), equal precision (predictive parity) or calibrated scores within each group. When base rates differ, predictive parity and equalized odds cannot both hold except for degenerate classifiers, calibration and both balance conditions cannot all hold except under perfect prediction, and calibration can be combined with at most one error-rate condition. Demographic parity and equal opportunity can hold together, at the cost of unequal false positive rates. Per-group thresholds can enforce one error-rate criterion on the data they were fitted to, possibly with randomization for equalized odds, but they need the group attribute, they move the other gaps, and they must be re-measured as data change. Differential privacy can widen accuracy gaps, so it complements a fairness evaluation rather than replacing one.
References
- Bagdasaryan, E., Poursaeed, O., and Shmatikov, V. (2019). Differential privacy has disparate impact on model accuracy. Advances in Neural Information Processing Systems, 32. https://proceedings.neurips.cc/paper_files/paper/2019/hash/fc0de4e0396fff257ea362983c2dda5a-Abstract.html
- Chouldechova, A. (2017). Fair prediction with disparate impact: A study of bias in recidivism prediction instruments. Big Data, 5(2), 153-163. https://doi.org/10.1089/big.2016.0047
- European Parliament and Council of the European Union (2024). Regulation (EU) 2024/1689 of the European Parliament and of the Council of 13 June 2024 laying down harmonised rules on artificial intelligence and amending Regulations (EC) No 300/2008, (EU) No 167/2013, (EU) No 168/2013, (EU) 2018/858, (EU) 2018/1139 and (EU) 2019/2144 and Directives 2014/90/EU, (EU) 2016/797 and (EU) 2020/1828 (Artificial Intelligence Act). Official Journal of the European Union, L series. OJ L 2024/1689, 12 July 2024. http://data.europa.eu/eli/reg/2024/1689/oj
- European Parliament and Council of the European Union (2026). Regulation (EU) 2026/1744 of the European Parliament and of the Council of 8 July 2026 amending Regulations (EU) 2024/1689, (EU) 2018/1139 and (EU) 2023/1230 as regards the simplification of the implementation of harmonised rules on artificial intelligence (Digital Omnibus on AI). Official Journal of the European Union, L series. OJ L 2026/1744, 24 July 2026. http://data.europa.eu/eli/reg/2026/1744/oj
- Grother, P., Ngan, M., and Hanaoka, K. (2019). Face recognition vendor test (FRVT) part 3: Demographic effects. National Institute of Standards and Technology. NISTIR 8280, December 2019. https://doi.org/10.6028/NIST.IR.8280
- Hardt, M., Price, E., and Srebro, N. (2016). Equality of opportunity in supervised learning. Advances in Neural Information Processing Systems, 29. https://papers.nips.cc/paper_files/paper/2016/hash/6a9659feb1216f14f7384ba499518b38-Abstract.html
- Kleinberg, J., Mullainathan, S., and Raghavan, M. (2017). Inherent trade-offs in the fair determination of risk scores. 8th Innovations in Theoretical Computer Science Conference (ITCS 2017), Leibniz International Proceedings in Informatics (LIPIcs), 67, 43:1-43:23. https://doi.org/10.4230/LIPIcs.ITCS.2017.43
- Pleiss, G., Raghavan, M., Wu, F., Kleinberg, J., and Weinberger, K. Q. (2017). On fairness and calibration. Advances in Neural Information Processing Systems, 30. https://proceedings.neurips.cc/paper_files/paper/2017/hash/b8b9c74ac526fffbeb2d39ab038d1cd7-Abstract.html