Module 26 · Apply

End-to-end classroom project

Clean, audit, summarize, visualize, and export a small dataset with an explanation of every choice.

Before you start: Core modules and plotting; keep raw and clean data distinct.

Python loads from this site on your first run.

Each run starts with fresh data. Download any exported files before another run. Your written answers and code drafts are saved on this device; export your work to keep a backup.

M26C01 · Explore · predict · practice

Clean the raw table and keep an audit trail

Bring the cleaning skills together. Remove the known exact duplicate, normalize labels, preserve why a score is unavailable, and flag impossible attendance as missing. This exercise makes no assumption that an absent score equals zero.

Read the example

df = raw_students().drop_duplicates().copy()
df["Name"] = df["Name"].astype("string").str.strip()
df["Campus"] = df["Campus"].astype("string").str.strip().str.title()
df["Campus"] = df["Campus"].replace({"Rak": "RAK"})
df["Score_Status"] = "recorded"
df.loc[df["Score"].isna(), "Score_Status"] = "missing"
df.loc[df["Score"].eq("absent"), "Score_Status"] = "absent"
df["Score"] = pd.to_numeric(df["Score"], errors="coerce").astype("Float64")
df["Study_Hours"] = pd.to_numeric(df["Study_Hours"], errors="coerce").astype("Float64")
df["Attendance"] = df["Attendance"].astype("Float64")
df.loc[~df["Attendance"].between(0, 100), "Attendance"] = pd.NA
df["Join_Date"] = pd.to_datetime(df["Join_Date"], format="%Y-%m-%d")

print(df[["Student_ID", "Name", "Campus", "Score", "Score_Status", "Attendance"]])
print("Rows:", len(df))
print("Unavailable scores:", df["Score"].isna().sum())
Verified example output · pandas 2.2.3
   Student_ID    Name Campus  Score Score_Status  Attendance
0        S001   Amira    RAK   88.0     recorded        95.0
1        S002   Bilal  Dubai   72.0     recorded        85.0
2        S003   Chloe    RAK   91.0     recorded        98.0
3        S004    Dana  Dubai   <NA>      missing        78.0
4        S005   Ethan    RAK   79.0     recorded        90.0
5        S006  Fatima  Dubai   95.0     recorded        99.0
6        S007   Grace    RAK   84.0     recorded        92.0
7        S008  Hassan  Dubai   <NA>       absent        70.0
8        S009     Ivy    RAK   76.0     recorded        88.0
9        S010   Jamal  Dubai   89.0     recorded        96.0
10       S011  Khalid    RAK   68.0     recorded        <NA>
11       S012    Lina  Dubai   82.0     recorded        94.0
Rows: 12
Unavailable scores: 2

Watch for this. Do not discard the raw labels before you have recorded their meaning.

Your turn

Use the cleaned table to create a review list containing students with a missing Score, Study_Hours, or Attendance. Store it in result with columns Student_ID, Score, Study_Hours, and Attendance, then print result.

For the code check, keep these result variable names: result. Different valid approaches are welcome.

Show a hint

Use isna().any(axis=1) across the three columns.

Show one worked solution
df = raw_students().drop_duplicates().copy()
df["Name"] = df["Name"].astype("string").str.strip()
df["Campus"] = df["Campus"].astype("string").str.strip().str.title()
df["Campus"] = df["Campus"].replace({"Rak": "RAK"})
df["Score_Status"] = "recorded"
df.loc[df["Score"].isna(), "Score_Status"] = "missing"
df.loc[df["Score"].eq("absent"), "Score_Status"] = "absent"
df["Score"] = pd.to_numeric(df["Score"], errors="coerce").astype("Float64")
df["Study_Hours"] = pd.to_numeric(df["Study_Hours"], errors="coerce").astype("Float64")
df["Attendance"] = df["Attendance"].astype("Float64")
df.loc[~df["Attendance"].between(0, 100), "Attendance"] = pd.NA
df["Join_Date"] = pd.to_datetime(df["Join_Date"], format="%Y-%m-%d")

review_columns = ["Score", "Study_Hours", "Attendance"]
result = df.loc[df[review_columns].isna().any(axis=1), ["Student_ID"] + review_columns]
print(result)

Review S004, S006, S008, and S011. Each record has at least one unavailable or invalid value. A review flag does not tell you how the missing value should be replaced.

Compare your explanations
  1. Read. The original text distinguishes an absent student from an already missing score. Conversion alone would erase that distinction.
  2. Predict. 12 unique students remain; two scores are missing numerically, S004 and S008.
  3. Explain. The correct attendance is unknown. Capping would invent a value; flagging allows later correction from a source.

One quick check

What evidence supports changing 105 to missing?

What you should be able to explain. Clean with documented rules and preserve the reasons for missing values.

M26C02 · Explore · predict · practice

Report a mean with its denominator

A group average is easier to interpret when its sample count is visible. Count all students and count recorded scores separately. Pandas mean skips missing numeric scores by default; say that in your report.

Read the example

df = raw_students().drop_duplicates().copy()
df["Name"] = df["Name"].astype("string").str.strip()
df["Campus"] = df["Campus"].astype("string").str.strip().str.title()
df["Campus"] = df["Campus"].replace({"Rak": "RAK"})
df["Score_Status"] = "recorded"
df.loc[df["Score"].isna(), "Score_Status"] = "missing"
df.loc[df["Score"].eq("absent"), "Score_Status"] = "absent"
df["Score"] = pd.to_numeric(df["Score"], errors="coerce").astype("Float64")
df["Study_Hours"] = pd.to_numeric(df["Study_Hours"], errors="coerce").astype("Float64")
df["Attendance"] = df["Attendance"].astype("Float64")
df.loc[~df["Attendance"].between(0, 100), "Attendance"] = pd.NA
df["Join_Date"] = pd.to_datetime(df["Join_Date"], format="%Y-%m-%d")

result = (df.groupby("Campus", as_index=False)
          .agg(Students=("Student_ID", "size"),
               Recorded_Scores=("Score", "count"),
               Mean_Score=("Score", "mean")))
print(result.round(2))
Verified example output · pandas 2.2.3
  Campus  Students  Recorded_Scores  Mean_Score
0  Dubai         6                4        84.5
1    RAK         6                6        81.0

Watch for this. A polished mean without the number of observed values can mislead.

Your turn

Produce the same report by Program. Add Missing_Scores = Students - Recorded_Scores, then sort from highest to lowest Mean_Score.

For the code check, keep these result variable names: result. Different valid approaches are welcome.

Show a hint

Use groupby('Program'), named aggregation, and a new column.

Show one worked solution
df = raw_students().drop_duplicates().copy()
df["Name"] = df["Name"].astype("string").str.strip()
df["Campus"] = df["Campus"].astype("string").str.strip().str.title()
df["Campus"] = df["Campus"].replace({"Rak": "RAK"})
df["Score_Status"] = "recorded"
df.loc[df["Score"].isna(), "Score_Status"] = "missing"
df.loc[df["Score"].eq("absent"), "Score_Status"] = "absent"
df["Score"] = pd.to_numeric(df["Score"], errors="coerce").astype("Float64")
df["Study_Hours"] = pd.to_numeric(df["Study_Hours"], errors="coerce").astype("Float64")
df["Attendance"] = df["Attendance"].astype("Float64")
df.loc[~df["Attendance"].between(0, 100), "Attendance"] = pd.NA
df["Join_Date"] = pd.to_datetime(df["Join_Date"], format="%Y-%m-%d")

result = (df.groupby("Program", as_index=False)
          .agg(Students=("Student_ID", "size"),
               Recorded_Scores=("Score", "count"),
               Mean_Score=("Score", "mean")))
result["Missing_Scores"] = result["Students"] - result["Recorded_Scores"]
result = result.sort_values("Mean_Score", ascending=False)
print(result.round(2))

AI has six recorded scores and a mean of 85.83. IT has four recorded scores, two missing scores, and a mean of 77.25. These fictional data do not establish a general difference between programs.

Compare your explanations
  1. Read. Students counts rows. Recorded_Scores counts non-missing scores.
  2. Predict. Dubai has six students but only four recorded scores in the cleaned raw table.
  3. Explain. No. It is based on four recorded scores. The missing observations may also affect the interpretation.

One quick check

Which denominator does mean use here?

What you should be able to explain. Attach counts and missingness to summary statistics.

M26C03 · Explore · predict · practice

Join, audit, and select a follow-up list

Combine the cleaned records with assessment results, checking both match quality and row counts. The follow-up rule below uses an observed Score under 75 or a missing assessment. Unknown scores need separate review, not automatic failure.

Read the example

df = raw_students().drop_duplicates().copy()
df["Name"] = df["Name"].astype("string").str.strip()
df["Campus"] = df["Campus"].astype("string").str.strip().str.title()
df["Campus"] = df["Campus"].replace({"Rak": "RAK"})
df["Score_Status"] = "recorded"
df.loc[df["Score"].isna(), "Score_Status"] = "missing"
df.loc[df["Score"].eq("absent"), "Score_Status"] = "absent"
df["Score"] = pd.to_numeric(df["Score"], errors="coerce").astype("Float64")
df["Study_Hours"] = pd.to_numeric(df["Study_Hours"], errors="coerce").astype("Float64")
df["Attendance"] = df["Attendance"].astype("Float64")
df.loc[~df["Attendance"].between(0, 100), "Attendance"] = pd.NA
df["Join_Date"] = pd.to_datetime(df["Join_Date"], format="%Y-%m-%d")

joined = df.merge(assessment(), on="Student_ID", how="left",
                  validate="one_to_one", indicator=True)
mask = joined["Score"].lt(75).fillna(False) | joined["_merge"].eq("left_only")
result = joined.loc[mask, ["Student_ID", "Score", "Quiz", "_merge"]]
print(result)
Verified example output · pandas 2.2.3
   Student_ID  Score  Quiz     _merge
1        S002   72.0  14.0       both
10       S011   68.0  14.0       both
11       S012   82.0   NaN  left_only

Watch for this. A missing comparison may propagate pd.NA; decide how the rule treats unknowns.

Your turn

Create a separate audit with an outer merge. Show only unmatched IDs and whether each ID belongs to the student table or the assessment table.

For the code check, keep these result variable names: result. Different valid approaches are welcome.

Show a hint

Use how='outer', indicator=True, then filter _merge != 'both'.

Show one worked solution
df = raw_students().drop_duplicates().copy()
df["Name"] = df["Name"].astype("string").str.strip()
df["Campus"] = df["Campus"].astype("string").str.strip().str.title()
df["Campus"] = df["Campus"].replace({"Rak": "RAK"})
df["Score_Status"] = "recorded"
df.loc[df["Score"].isna(), "Score_Status"] = "missing"
df.loc[df["Score"].eq("absent"), "Score_Status"] = "absent"
df["Score"] = pd.to_numeric(df["Score"], errors="coerce").astype("Float64")
df["Study_Hours"] = pd.to_numeric(df["Study_Hours"], errors="coerce").astype("Float64")
df["Attendance"] = df["Attendance"].astype("Float64")
df.loc[~df["Attendance"].between(0, 100), "Attendance"] = pd.NA
df["Join_Date"] = pd.to_datetime(df["Join_Date"], format="%Y-%m-%d")

audit = df.merge(assessment(), on="Student_ID", how="outer",
                 validate="one_to_one", indicator=True)
result = audit.loc[audit["_merge"].ne("both"), ["Student_ID", "_merge"]]
print(result)

S012 is student-only; S013 is assessment-only. Investigate both before treating the assessment file as complete.

Compare your explanations
  1. Read. An unknown score should not be classified as below 75. Missing scores are handled by a separate review process.
  2. Predict. S012, Lina.
  3. Explain. No. It only means this specific rule does not classify that student. Missing data still need review.

One quick check

A missing score should automatically become a failing score.

What you should be able to explain. Keep classification rules separate from data-quality review.

M26C04 · Explore · predict · practice

Create a table, a plot, and a reproducible export

Finish with a compact report and a plot that answers a stated question. Keep the clean table and the summary as separate outputs. On a new run, rebuild the report from the source and the written cleaning rules.

Read the example

df = raw_students().drop_duplicates().copy()
df["Name"] = df["Name"].astype("string").str.strip()
df["Campus"] = df["Campus"].astype("string").str.strip().str.title()
df["Campus"] = df["Campus"].replace({"Rak": "RAK"})
df["Score_Status"] = "recorded"
df.loc[df["Score"].isna(), "Score_Status"] = "missing"
df.loc[df["Score"].eq("absent"), "Score_Status"] = "absent"
df["Score"] = pd.to_numeric(df["Score"], errors="coerce").astype("Float64")
df["Study_Hours"] = pd.to_numeric(df["Study_Hours"], errors="coerce").astype("Float64")
df["Attendance"] = df["Attendance"].astype("Float64")
df.loc[~df["Attendance"].between(0, 100), "Attendance"] = pd.NA
df["Join_Date"] = pd.to_datetime(df["Join_Date"], format="%Y-%m-%d")

result = df.pivot_table(index="Campus", columns="Program", values="Score",
                        aggfunc="mean", observed=True)
counts = df.pivot_table(index="Campus", columns="Program", values="Score",
                        aggfunc="count", observed=True)
print("Recorded mean scores:")
print(result.round(2))
print("Recorded score counts:")
print(counts)
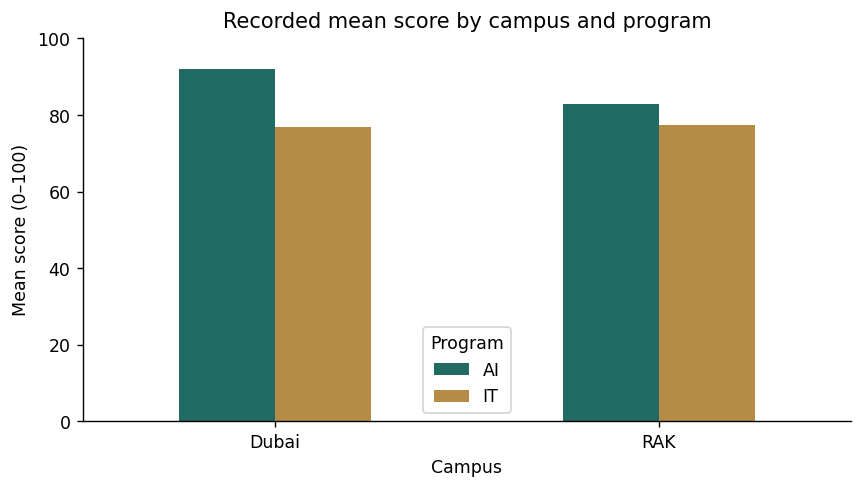
ax = result.plot.bar(color=["#216b62", "#b58b45"], rot=0)
ax.set_title("Recorded mean score by campus and program")
ax.set_ylabel("Mean score (0–100)")
ax.set_ylim(0, 100)
plt.tight_layout()
plt.show()
df.to_csv(OUTPUT_DIR / "capstone_cleaned_students.csv", index=False)
result.round(2).to_csv(OUTPUT_DIR / "capstone_score_summary.csv")
counts.to_csv(OUTPUT_DIR / "capstone_recorded_counts.csv")
print("Saved cleaned data, summary, and recorded counts in outputs/.")
Verified example output · pandas 2.2.3
Recorded mean scores:
Program     AI    IT
Campus              
Dubai     92.0  77.0
RAK      82.75  77.5
Recorded score counts:
Program  AI  IT
Campus         
Dubai     2   2
RAK       4   2
Saved cleaned data, summary, and recorded counts in outputs/.
Verified example figure for Create a table, a plot, and a reproducible export

Watch for this. CSV does not preserve every pandas dtype. Recheck dtypes when loading it later.

Your turn

Make a Program-level report with columns Program, Recorded_Scores, and Mean_Score. Export it without a DataFrame index to capstone_program_report.csv. Read the exported file back into read_back and verify its columns and row count.

For the code check, keep these result variable names: read_back. Different valid approaches are welcome.

Show a hint

Use groupby, agg, to_csv(index=False), and read_csv.

Show one worked solution
df = raw_students().drop_duplicates().copy()
df["Name"] = df["Name"].astype("string").str.strip()
df["Campus"] = df["Campus"].astype("string").str.strip().str.title()
df["Campus"] = df["Campus"].replace({"Rak": "RAK"})
df["Score_Status"] = "recorded"
df.loc[df["Score"].isna(), "Score_Status"] = "missing"
df.loc[df["Score"].eq("absent"), "Score_Status"] = "absent"
df["Score"] = pd.to_numeric(df["Score"], errors="coerce").astype("Float64")
df["Study_Hours"] = pd.to_numeric(df["Study_Hours"], errors="coerce").astype("Float64")
df["Attendance"] = df["Attendance"].astype("Float64")
df.loc[~df["Attendance"].between(0, 100), "Attendance"] = pd.NA
df["Join_Date"] = pd.to_datetime(df["Join_Date"], format="%Y-%m-%d")

result = (df.groupby("Program", as_index=False)
          .agg(Recorded_Scores=("Score", "count"), Mean_Score=("Score", "mean")))
result["Mean_Score"] = result["Mean_Score"].round(2)
path = OUTPUT_DIR / "capstone_program_report.csv"
result.to_csv(path, index=False)
read_back = pd.read_csv(path)
print(read_back)
print("Columns preserved:", read_back.columns.tolist() == result.columns.tolist())

The CSV contains Program, Recorded_Scores, and Mean_Score, with no extra unnamed index column. Reading the file back checks the delivered table, not just the in-memory object.

Compare your explanations
  1. Read. Campus is stored in the pivot table index and carries meaning. Removing it would lose the campus labels.
  2. Predict. Four: AI and IT within Dubai and RAK.
  3. Explain. The number of recorded scores per group, the missing-score policy, and a note that these are fictional teaching data. Bar differences do not prove causation.

One quick check

When is index=False appropriate for this Program report?

What you should be able to explain. Deliver a report that another person can reproduce and interpret.
Further detail: official documentation for this topic.