Unit 12 · Lesson 12.1
Planning, running and reporting a project
The capstone is a project of your own, from a question to a report that someone else could check and repeat. It is where the course's methods come together, and where most of their failure modes reappear at once. This lesson gives a plan in four parts: choosing a problem and data you may use, stating the threat model and the decision the model supports, evaluating with a protocol drawn from the whole course, and reporting with a reproducibility package. It ends with a rubric for assessing your own work, project ideas of three sizes, and the ethics of working with security data and of disclosing what you find.
Choosing a problem and data you may use
A good capstone problem has three properties. Someone would act on the model's output, so the project has a decision to evaluate. Labeled or labelable data exist that you are allowed to use. And the problem is small enough that you can evaluate it properly; a careful study of one detector on one dataset teaches more than a hurried comparison of ten.
Data authorization comes first. Public research datasets usually come with a license or terms of use, and the terms differ from one dataset to the next; read them on the dataset's own page, and record them in your datasheet (Lesson 11.3). Synthetic data, such as the course datasets, avoid most legal questions but limit what you can claim about real networks. Data you collect yourself, for example traffic from a home laboratory of virtual machines, is yours to use, but logs from an employer, a university network or a cloud account that someone else owns belong to their owners and usually contain personal data such as addresses, user names and message content; using them requires the owner's written permission and a plan for protecting the people in them. Never generate attack traffic against systems you do not own or have explicit written permission to test. Results obtained from unauthorized data or unauthorized testing should not be published, however good the technical work.
Threat model and decision
Write down, before any modeling, who the adversary is and what the model is for. The threat model of Lesson 7.1 asks what the adversary wants, what they know about the system and what they can change: the traffic, the training data, the model's inputs in feature space or only in problem space. The decision asks what happens when the model raises an alert. An alert that an analyst reviews has a cost per false alert measured in minutes; an alert that blocks a payment or locks an account has a cost borne by a customer or an employee; an alert that feeds an automated response can be turned against the organization by an attacker who triggers it on purpose. The decision fixes the operating point you evaluate at, through an alert budget or the cost threshold of Lesson 1.2, and the metric you report. A detector meant for analyst triage is judged by precision and recall at a budget of alerts per day, not by accuracy.
Write the threat model and the decision as one paragraph each, early. Every later choice should trace back to them, and a reader of your report should be able to check whether your evaluation tested what they claim.
The evaluation protocol
The checklist in the table below gathers the evaluation practices of the course. Arp et al. (2022) list ten pitfalls of machine learning in security, from sampling bias and data snooping to the base-rate fallacy, lab-only evaluation and an inappropriate threat model, and in a study of 30 papers from top security venues found every paper affected, at least partly, by at least three of them. Kapoor and Narayanan (2023) organize leakage into a taxonomy that runs from having no separate test set, through preprocessing or feature selection on training and test data together and duplicates across the split, to illegitimate features, temporal leakage, non-independence between training and test samples, and sampling bias in the test distribution. The protocol is designed to avoid both lists.
| Item | What to do |
|---|---|
| Split | Split in time when the model will predict the future, and by group (host, user, family, site) when records within a group are dependent; never a random split of time-ordered or grouped records. See Lesson 2.2 and Pendlebury et al. (2019). |
| Leakage | Check for identifiers, post-event fields (such as ticket_opened), duplicates across the split, and preprocessing fitted on the test data. See Lab 2 and Kapoor and Narayanan (2023). |
| Threshold | Choose thresholds and hyperparameters on training or validation data only. See Lessons 2.2 and 2.3. |
| Base rate and budget | Report precision and alerts per day at the deployment base rate and alert budget. See Lessons 1.2 and 2.3. |
| Baselines | Include a simple rule written by hand and a simple model (logistic regression), and report the cost of each improvement over them. See Lesson 3.1 and Arp et al. (2022). |
| Variation | Repeat with several random seeds and report the mean with an interval; report intervals for rates by bootstrap or Wilson. See below and Lessons 3.3 and 10.2. |
| Disaggregation | Report results per attack family, per site or group, and per period. See Lab 1 and Lesson 11.2. |
| Robustness | Test against evasion that respects problem-space constraints, and against poisoning if training data can be influenced. See Units 7 and 8. |
| Drift | Measure performance on later periods than the training data, and state how you would monitor it. See Lessons 1.3 and 11.3. |
| Ablations | Remove one component or feature group at a time to show which part of the system produces the result. See below. |
Two of the items need a word more. Spatial bias, in the terms of Pendlebury et al. (2019), arises when the share of attacks in the test data differs from the share in deployment, and temporal bias when the split lets the model learn from the future. They argue that both inflate published results. The split addresses temporal bias, and reporting at the deployment base rate addresses spatial bias in the test data. Ablations answer the question every reader asks of a new method, which part of it matters. If a detector combines new features with a new model, train the new model on the old features and the old model on the new features; if most of the gain comes from the features, the report should say so.
For variation across seeds, report the mean \(\bar{m}\) of a metric over \(k\) runs with a 95% \(t\) interval,
where \(s\) is the sample standard deviation of the \(k\) values and \(t_{0.975,\,k-1}\) the 97.5% quantile of the \(t\) distribution with \(k - 1\) degrees of freedom. Five runs with average precision 0.61, 0.64, 0.59, 0.66 and 0.62 give \(\bar{m} = 0.624\) and \(s = 0.0270\); with \(t_{0.975,4} = 2.776\), equation \eqref{eq:seeds} gives the interval \(0.624 \pm 0.034\). This interval describes variation due to the random seed only, such as initialization and the order of training examples. It says nothing about how results would change with another test period or another network, which is why the temporal and per-group results in the checklist are reported separately. When comparing two methods, run both with the same seeds and analyze the per-seed differences, which removes the variation the two runs share.
Show the answer
It fails the split item, since a random split of time-ordered records lets the model train on days after those it is tested on, and the course dataset contains a family that appears only in the last days. It also fails the leakage item unless the duplicates (2.9% of records, Lesson 1.3) were removed before the split, since a random split puts copies on both sides. In Lab 2 the effect of these copies on AP was too small to measure, but the protocol requires the check whatever the expected effect. It does not report precision at a deployment base rate or per-family results. More seeds would only narrow the interval around the same inflated estimate, because the seeds vary the model's randomness, not the flaw in the protocol.
Writing the report
The job of a report is to let a reader decide whether to believe and use your result. A structure that serves that job has seven parts. The problem and threat model state what is detected, by whom, against which adversary, and which decision the model supports. The data section summarizes the datasheet: source, authorization, time span, labeling, base rate, duplicates and known artifacts. The method section gives the features and models with enough detail to reimplement them. The evaluation protocol states the split, the threshold choice, the metrics at the operating point, the baselines and the number of runs. The results report the main comparison with intervals, then disaggregated results, robustness and drift. An analysis of errors looks at the false positives and false negatives themselves, since a table of rates rarely shows why a detector fails. The scope and limitations paragraph states once, plainly, what the evaluation does not cover (for example, a single network, synthetic data, no adaptive attacker) and what further work would test.
Every figure should be produced by code from saved results, with labeled axes and units and a caption that says what is plotted and on which data. Every number in the text should come from those results, not be typed by hand, so that rerunning the code updates the report; the lessons of this course follow that rule, quoting every lab result from the files the labs save (Lesson 1.3).
The reproducibility package
Pineau et al. (2021) describe the reproducibility program of the NeurIPS 2019 conference, which combined a code submission policy, a reproducibility challenge and a checklist that authors completed at submission. The checklist asks, among other things, for a clear description of the setting and algorithm, a clear definition of the measures or statistics used to report results, a description of how experiments were run, clearly defined error bars, and a description of results with a central tendency (such as the mean) and a variation (such as the standard deviation). In their analysis of the submitted answers, 87% of papers saw value in clearly defining the metrics and statistics used, yet 36% judged that error bars were not applicable to their results.
For a security project, a package that someone else can run contains the code that produces every number and figure; a list of dependencies with exact versions; the data, or a script that downloads it from its source and checks its digest, together with the datasheet; the random seeds; a README that states how to reproduce each result, how long it takes and on what hardware; and a license for the code that does not contradict the terms of the data. Run the package once from a clean copy before you call it finished; missing files and absolute paths are found only that way.
A rubric for self-assessment
The rubric in the table below describes three levels for each part of the project, with each criterion (in italics) followed by one row per level. A criterion reaches a level only when everything in that level's cell holds, and each level includes the one before it; a project that meets part of a cell stays at the level below. Use the rubric before you write the report, to find the weakest part while there is still time to fix it.
| Criterion and level | What must hold |
|---|---|
| Problem and threat model | |
| Not yet | Problem stated without an adversary or without the decision the model supports |
| Adequate | Adversary and decision stated |
| Strong | Adversary's goal, knowledge and capabilities, the decision, the costs of errors and the alert budget stated, and used to choose the metrics |
| Data | |
| Not yet | Source only, or authorization not checked |
| Adequate | Source, license or terms of use, base rate and time span recorded |
| Strong | Full datasheet, including labeling, duplicates, known artifacts and the handling of personal data |
| Evaluation protocol | |
| Not yet | Random split of time-ordered or grouped records, or accuracy as the main metric |
| Adequate | Split in time or by group as the data require, and precision and recall at a stated threshold |
| Strong | Leakage checks done, thresholds and hyperparameters chosen without test data, precision and alerts per day reported at the deployment base rate and alert budget |
| Baselines and ablations | |
| Not yet | No baseline |
| Adequate | A simple model as baseline |
| Strong | A hand-written rule and a simple model, plus ablations that attribute the gain |
| Uncertainty | |
| Not yet | Single run, no intervals |
| Adequate | Several seeds or bootstrap intervals for the main result |
| Strong | Intervals on every reported rate, and paired comparisons across seeds |
| Disaggregation and robustness | |
| Not yet | Aggregate results only |
| Adequate | Per-family or per-group results |
| Strong | Per-family, per-group and per-period results, plus an evasion or poisoning test under realistic constraints |
| Report | |
| Not yet | Results without a method section or without stated limitations |
| Adequate | All seven sections present |
| Strong | All sections present, every number and figure generated from saved results, and an error analysis that examines individual false positives and false negatives |
| Reproducibility | |
| Not yet | Code not shared |
| Adequate | Code, pinned dependencies and run instructions shared |
| Strong | A clean-copy run of the package succeeds and reproduces every number |
Project ideas at three sizes
A small project (about 10 hours) extends one of the course's labs. For example, take Lab 1's logistic regression, which already uses a temporal split and reports recall per family, and add a hand-written rule baseline, a validation period inside the training days with a threshold chosen on it for an alert budget of 20 alerts a day (as Lab 2 does for gradient boosting), bootstrap intervals for precision and recall, and per-site results at that threshold. Or extend Lab 10a with an adaptive injection against the delimiter defense and a combined defense, with a number of documents chosen by the sample-size formula of Lesson 10.2.
A medium project (about 25 hours) builds a detector for a new problem on a public dataset, with the full evaluation checklist. Three of the public datasets of Lesson 1.3, CICIDS2017, UNSW-NB15 and EMBER, are starting points, to be used with their documented problems and their base rates in mind and under the terms stated on their own pages. Examples are a phishing URL detector trained on URLs from a public feed of reported phishing pages and evaluated on URLs reported after the training period, a log-anomaly detector evaluated per host with a drift analysis, or an audit of a published detector's model card against your own measurements.
A large project (about 50 hours) adds an adversary. Examples are a network-flow detector evaluated against problem-space evasion, extending Lab 7b, and retrained with the evasive samples, measuring the cost in false positives; a retrieval system for security advisories with a poisoning study and access-control tests; or a tool-using agent with injection tests on realistic tasks, comparing prompt-level defenses with least-privilege controls. A problem-space study of malware needs the executables themselves. EMBER releases extracted features with the SHA-256 hash of each file, not the files (Anderson and Roth, 2018), so such a project has to obtain samples lawfully and handle them in an isolated environment.
Figure 12.1 summarizes the stages of any of these projects and the artifact each stage leaves behind.
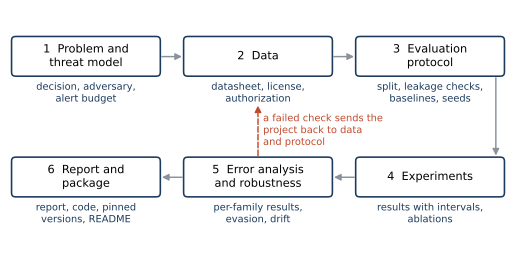
Figure 12.1. The stages of a capstone project and the artifact each produces, from a problem statement with its threat model to a reproducibility package. Solid arrows give the order of the stages. The dashed arrow marks the return path taken when a check in the error analysis fails, for example when the errors reveal a leaked feature or duplicated records, so that the project goes back to the data and then repeats the protocol and the experiments. Schematic.
Ethics and responsible disclosure
Security projects can find real weaknesses, such as a vulnerable service in a laboratory image, a prompt injection in a commercial tool or a detector that misses a whole attack family. Coordinated vulnerability disclosure is the process of gathering information from the people who find vulnerabilities, coordinating the sharing of that information between the relevant parties, and disclosing the vulnerability and its mitigations, in the definition of the CERT guide (Householder et al., 2017). The guide's principles include reducing harm, presuming benevolence, avoiding surprise and incentivizing desired behavior. ISO/IEC 29147:2018 gives vendors requirements and recommendations for receiving reports about potential vulnerabilities and for disclosing remediation information (International Organization for Standardization and International Electrotechnical Commission, 2018). In practice, if your project finds a vulnerability in someone else's product, report it privately through the vendor's published channel, give them a reasonable time to fix it before publishing details, and in your report describe the weakness at the level needed to support your findings, leaving out a working attack until the vendor has fixed the problem or that time has passed.
Three further obligations apply to every project. Protect the people in your data by removing or pseudonymizing identifiers you do not need, and never publish raw logs that contain personal data. Do not release models or datasets whose main use would be attack, such as a classifier tuned to evade a specific vendor's detector, without considering who gains from them. And report results as they are. A negative result, such as a published method that fails under a temporal split, is a contribution when the protocol is sound.
Show the answer
Report it privately to the vendor through its published security contact or vulnerability disclosure program, with enough detail to reproduce it, and agree on a timeline before publishing. Confirm that your testing used only accounts and systems you were authorized to use. In the report, describe the class of weakness (indirect prompt injection affecting summaries, Lesson 10.2, listed as LLM01:2025 Prompt Injection by OWASP (OWASP Foundation, 2024)) and its measured rate, and include the exact payload only after the vendor has fixed the problem or the agreed period has passed.
Summary
A capstone project starts from a decision someone would make with the model and from data you are authorized to use, and it states the adversary and the operating point before any modeling. Its evaluation follows a protocol that avoids the known pitfalls: a temporal or grouped split, leakage checks, thresholds chosen without test data, reporting at the deployment base rate and alert budget, simple baselines, intervals across seeds and on rates, results per family, group and period, robustness and drift tests, and ablations. The report states the threat model, data, method, protocol, results, error analysis and scope, with every number generated from saved results, and the reproducibility package lets someone else rerun all of it from a clean copy. Findings that reveal real vulnerabilities are disclosed in coordination with the people who can fix them.
References
- Anderson, H. S., and Roth, P. (2018). EMBER: An open dataset for training static PE malware machine learning models. arXiv preprint arXiv:1804.04637. https://arxiv.org/abs/1804.04637
- Arp, D., Quiring, E., Pendlebury, F., Warnecke, A., Pierazzi, F., Wressnegger, C., Cavallaro, L., and Rieck, K. (2022). Dos and don'ts of machine learning in computer security. Proceedings of the 31st USENIX Security Symposium, 3971-3988. https://www.usenix.org/conference/usenixsecurity22/presentation/arp
- Householder, A. D., Wassermann, G., Manion, A., and King, C. (2017). The CERT guide to coordinated vulnerability disclosure. Software Engineering Institute, Carnegie Mellon University. Special report CMU/SEI-2017-SR-022, 15 August 2017. https://doi.org/10.1184/R1/12367340.v1
- International Organization for Standardization and International Electrotechnical Commission (2018). ISO/IEC 29147:2018 Information technology: Security techniques: Vulnerability disclosure. ISO/IEC JTC 1/SC 27. Edition 2, October 2018. https://www.iso.org/standard/72311.html
- Kapoor, S., and Narayanan, A. (2023). Leakage and the reproducibility crisis in machine-learning-based science. Patterns, 4(9), 100804. https://doi.org/10.1016/j.patter.2023.100804
- OWASP Foundation (2024). OWASP Top 10 for LLM Applications 2025. OWASP Gen AI Security Project. Version 2025, released 18 November 2024. https://genai.owasp.org/resource/owasp-top-10-for-llm-applications-2025/
- Pendlebury, F., Pierazzi, F., Jordaney, R., Kinder, J., and Cavallaro, L. (2019). TESSERACT: Eliminating experimental bias in malware classification across space and time. Proceedings of the 28th USENIX Security Symposium, 729-746. https://www.usenix.org/conference/usenixsecurity19/presentation/pendlebury
- Pineau, J., Vincent-Lamarre, P., Sinha, K., Larivière, V., Beygelzimer, A., d'Alché-Buc, F., Fox, E., and Larochelle, H. (2021). Improving reproducibility in machine learning research (a report from the NeurIPS 2019 reproducibility program). Journal of Machine Learning Research, 22(164), 1-20. https://jmlr.org/papers/v22/20-303.html